Linear Discriminant Analysis

K-fold CV (caret)

Show/Hide Code
#---------------------------#
#----Model Construction-----#
#---------------------------#
set.seed(1234)
train_control <- trainControl(method = "cv", number = 10)

set.seed(1234)
lda_model <- train(as.factor(good) ~ ., 
                   data = train, 
                   method = "lda", 
                   trControl = train_control)

save(lda_model, file = "dataset\\lda.model_kfoldCV.Rdata")
Show/Hide Code
# Data Import
load("dataset\\wine.data_cleaned.Rdata")
load("dataset\\train.Rdata")
load("dataset\\test.Rdata")

# Function Import
load("dataset\\function\\accu.kappa.plot.Rdata")

# Model import
load("dataset\\model\\lda.model_kfoldCV.Rdata")

lda.predictions <- predict(lda_model, newdata = test)

confusionMatrix(lda.predictions, test$good)
Confusion Matrix and Statistics

          Reference
Prediction   0   1
         0 881 160
         1  68  79
                                          
               Accuracy : 0.8081          
                 95% CI : (0.7845, 0.8301)
    No Information Rate : 0.7988          
    P-Value [Acc > NIR] : 0.2246          
                                          
                  Kappa : 0.3024          
                                          
 Mcnemar's Test P-Value : 1.674e-09       
                                          
            Sensitivity : 0.9283          
            Specificity : 0.3305          
         Pos Pred Value : 0.8463          
         Neg Pred Value : 0.5374          
             Prevalence : 0.7988          
         Detection Rate : 0.7416          
   Detection Prevalence : 0.8763          
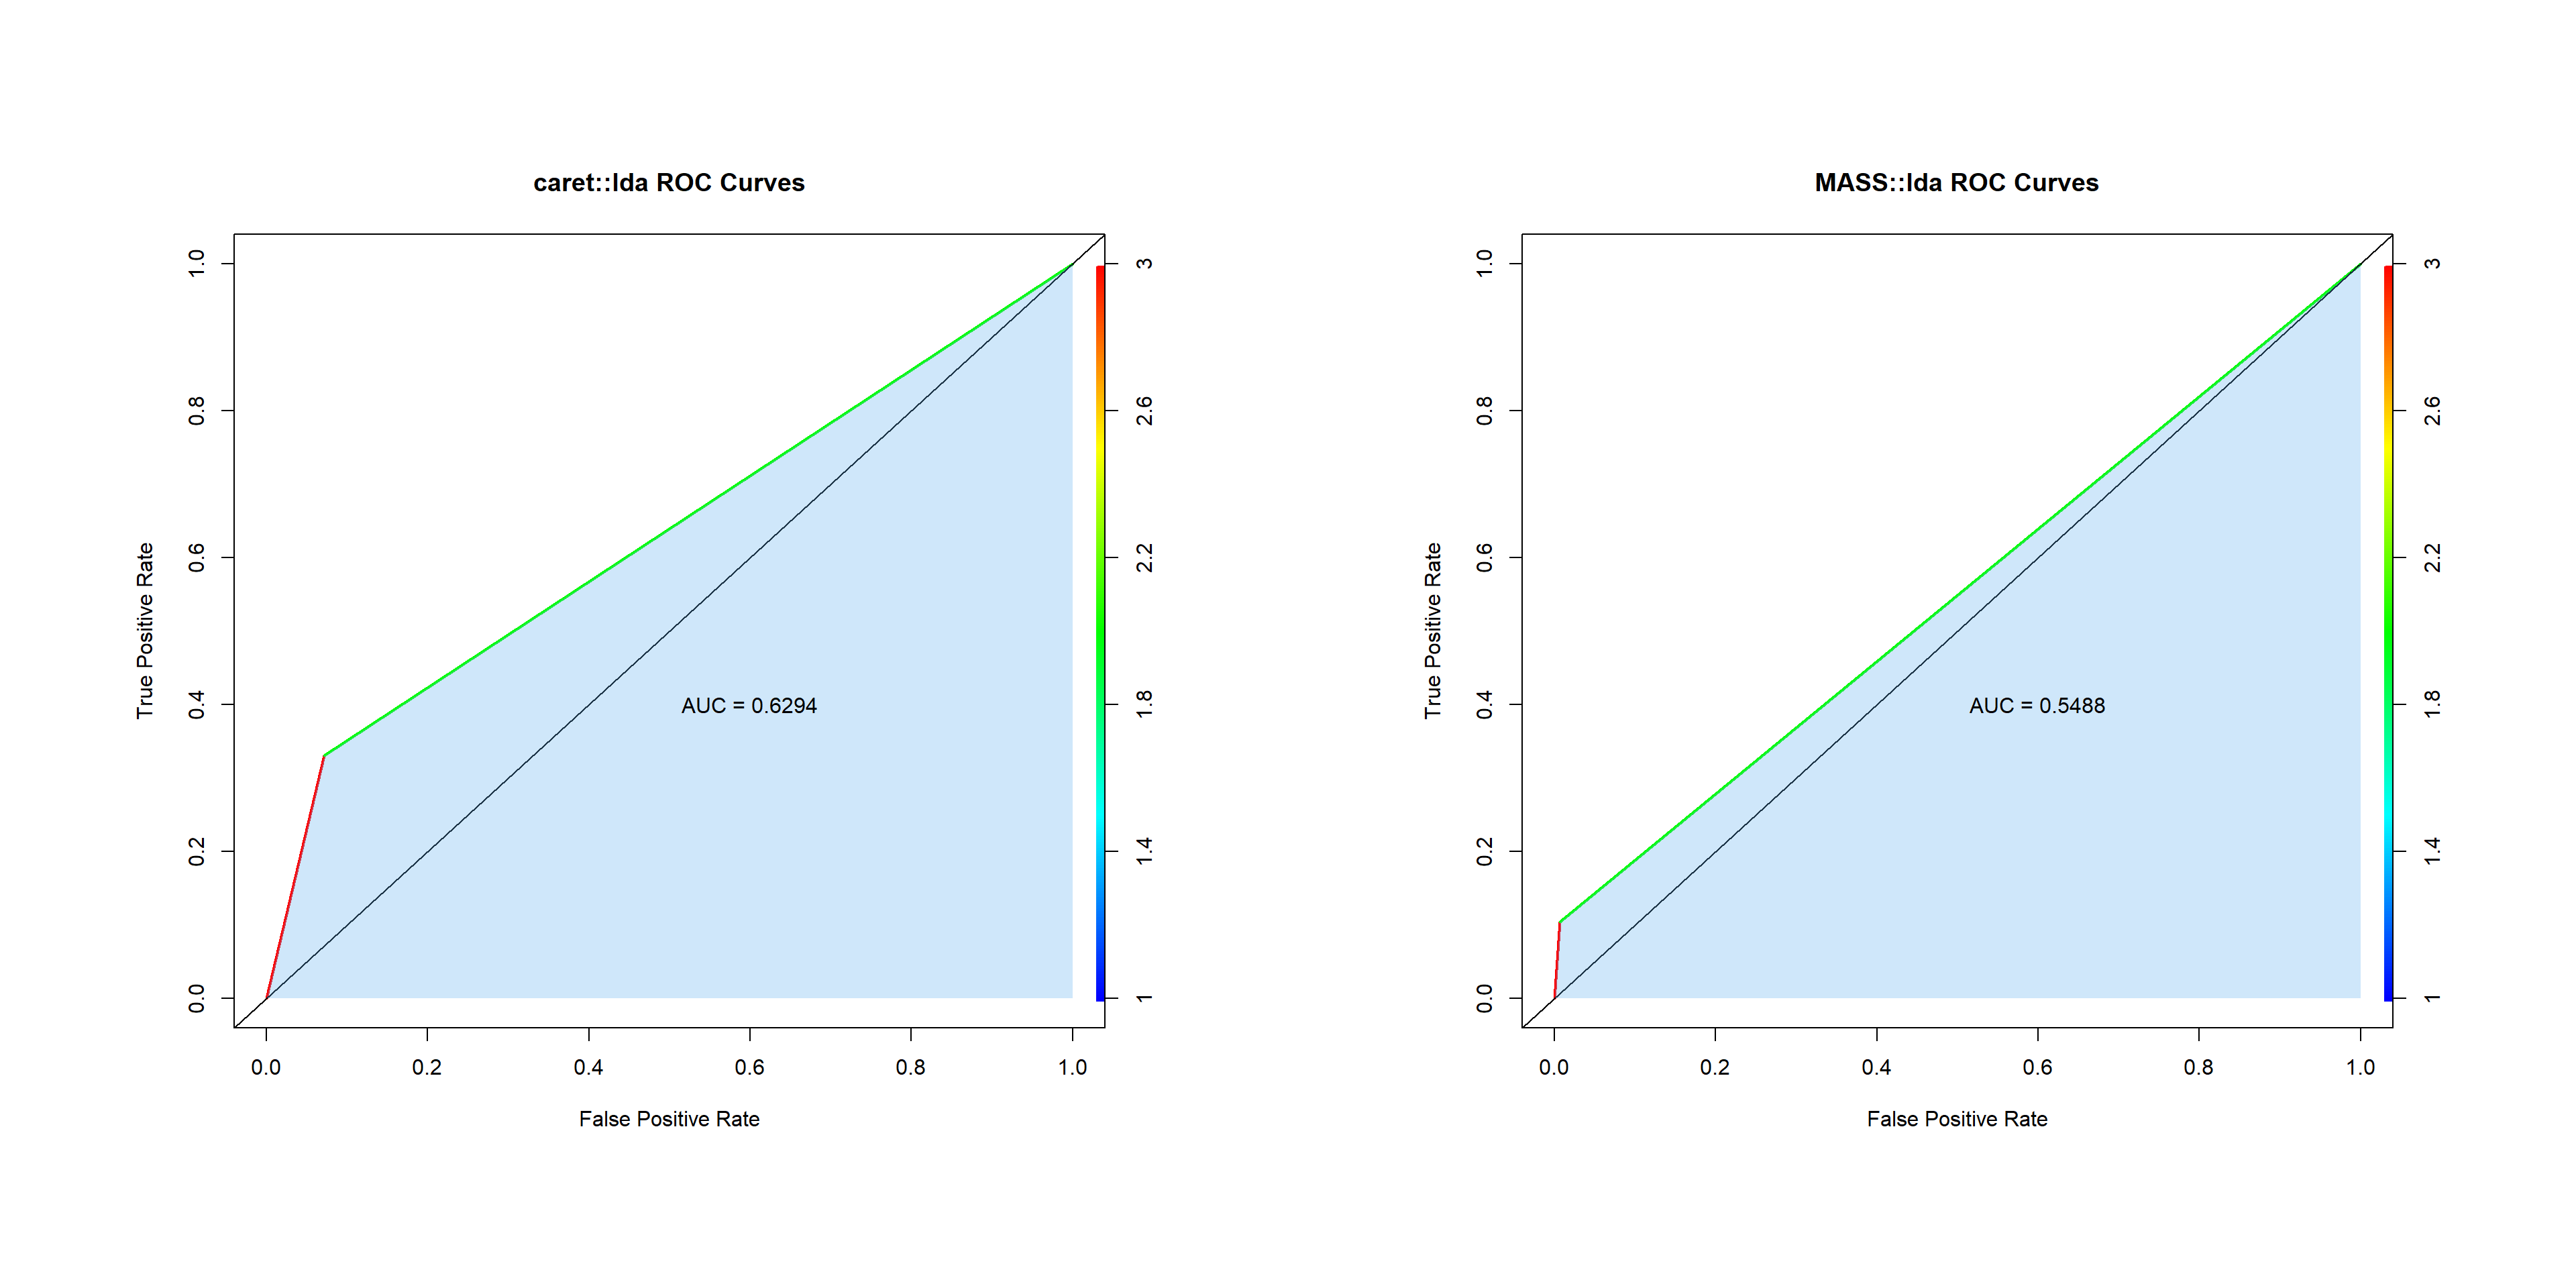
      Balanced Accuracy : 0.6294          
                                          
       'Positive' Class : 0               
                                          
Show/Hide Code
lda.predictions <- as.numeric(lda.predictions)
pred_obj <- prediction(lda.predictions, test$good)

# Compute AUC value
auc_val <- performance(pred_obj, "auc")@y.values[[1]]
auc_val
[1] 0.6294448
Show/Hide Code
lda.perf <- performance(pred_obj, "tpr", "fpr")
plot(lda.perf, colorize = TRUE, lwd = 2,
     xlab = "False Positive Rate", 
     ylab = "True Positive Rate",
     main = "caret::lda ROC Curves")
abline(a = 0, b = 1)
x_values <- as.numeric(unlist(lda.perf@x.values))
y_values <- as.numeric(unlist(lda.perf@y.values))
polygon(x = x_values, y = y_values, 
        col = rgb(0.3803922, 0.6862745, 0.9372549, alpha = 0.3),
        border = NA)
polygon(x = c(0, 1, 1), y = c(0, 0, 1), 
        col = rgb(0.3803922, 0.6862745, 0.9372549, alpha = 0.3),
        border = NA)
text(0.6, 0.4, paste("AUC =", round(auc_val, 4)))
Show/Hide Code
lda.kfoldCV_caret.ROC.plot <- recordPlot()

K-fold CV (MASS)

Show/Hide Code
# Set the number of folds
k <- 10

# Randomly assign each row in the data to a fold
set.seed(1234) # for reproducibility
fold_indices <- sample(rep(1:k, length.out = nrow(wine.data_cleaned)))

# Initialize an empty list to store the folds
folds <- vector("list", k)

# Assign each row to a fold
for (i in 1:k) {
  folds[[i]] <- which(fold_indices == i)
}

#To store the error rate of each fold
error_rate <- numeric(k)
kappa <- numeric(k)
confusion_matrices <- vector("list", k)

# Loop through each fold
for (i in 1:10) {
  # Extract the i-th fold as the testing set
  test_indices <- unlist(folds[[i]])
  
  test <- wine.data_cleaned[test_indices, ]
  train <- wine.data_cleaned[-test_indices, ]
  
  # Fit the model on the training set
  lda_model <- lda(good ~ ., data = train, family = binomial)
  
  # Make predictions on the testing set and calculate the error rate
  lda.pred <- predict(lda_model, newdata = test, type = "response")
  predicted_classes <- ifelse(lda.pred$posterior[, 2] > 0.7, 1, 0)

  # Compute OER
  error_rate[i] <- mean((predicted_classes > 0.7) != as.numeric(test$good))
  
  # Compute confusion matrix
  test$good <- as.factor(test$good)
  predicted_classes <- factor(predicted_classes, levels = c(0, 1))
  confusion_matrices[[i]] <- caret::confusionMatrix(predicted_classes, test$good)
  
  # Compute Kappa value
  kappa[i] <- confusion_matrices[[i]]$overall[[2]]
  
  # Print the error rates for each fold
  cat(paste0("Fold ", i, ": ", "OER:", error_rate[i], "\n"))
}
Fold 1: OER:0.193954659949622
Fold 2: OER:0.174242424242424
Fold 3: OER:0.202020202020202
Fold 4: OER:0.23989898989899
Fold 5: OER:0.176767676767677
Fold 6: OER:0.222222222222222
Fold 7: OER:0.184343434343434
Fold 8: OER:0.194444444444444
Fold 9: OER:0.159090909090909
Fold 10: OER:0.179292929292929
Show/Hide Code
best_confmat_index <- which.min(error_rate)
best_confmat_index
[1] 9
Show/Hide Code
confusion_matrices[best_confmat_index]
[[1]]
Confusion Matrix and Statistics

          Reference
Prediction   0   1
         0 325  62
         1   1   8
                                          
               Accuracy : 0.8409          
                 95% CI : (0.8011, 0.8755)
    No Information Rate : 0.8232          
    P-Value [Acc > NIR] : 0.197           
                                          
                  Kappa : 0.1691          
                                          
 Mcnemar's Test P-Value : 4.053e-14       
                                          
            Sensitivity : 0.9969          
            Specificity : 0.1143          
         Pos Pred Value : 0.8398          
         Neg Pred Value : 0.8889          
             Prevalence : 0.8232          
         Detection Rate : 0.8207          
   Detection Prevalence : 0.9773          
      Balanced Accuracy : 0.5556          
                                          
       'Positive' Class : 0               
                                          
Show/Hide Code
#AUC and Performance Plot
predicted_classes <- as.numeric(predicted_classes)
pred_obj <- prediction(predicted_classes, test$good)
lda.perf <- performance(pred_obj,"tpr","fpr")
auc_val <- performance(pred_obj, "auc")@y.values[[1]]
auc_val
[1] 0.5488133
Show/Hide Code
plot(lda.perf, colorize = TRUE, lwd = 2,
     xlab = "False Positive Rate", 
     ylab = "True Positive Rate",
     main = "MASS::lda ROC Curves")
abline(a = 0, b = 1)
x_values <- as.numeric(unlist(lda.perf@x.values))
y_values <- as.numeric(unlist(lda.perf@y.values))
polygon(x = x_values, y = y_values, 
        col = rgb(0.3803922, 0.6862745, 0.9372549, alpha = 0.3),
        border = NA)
polygon(x = c(0, 1, 1), y = c(0, 0, 1), 
        col = rgb(0.3803922, 0.6862745, 0.9372549, alpha = 0.3),
        border = NA)
text(0.6, 0.4, paste("AUC =", round(auc_val, 4)))
Show/Hide Code
lda.kfoldCV_MASS.ROC.plot <- recordPlot()

lda_df <- data.frame(k = 1:k,
                     Accuracy = 1-error_rate, 
                     Kappa = kappa)

lda.kfoldCV_MASS.plot <- accu.kappa.plot(lda_df) + 
  geom_text(aes(x = k, y = Accuracy, label = round(Accuracy, 3)), vjust = -1) +
  geom_text(aes(x = k, y = Kappa, label = round(Kappa, 3)), vjust = -1) +
  ggtitle("MASS::lda Model Performance (10-Fold CV)")
Show/Hide Code
png("dataset\\plot\\lda.png", width = 2000, height = 2000, res = 150)
klaR::partimat(as.factor(good) ~ ., data = train, method = "lda", 
         control = list(adip = 0.7, col.unmatched = "grey", 
                        col.matched = c("#E69F00", "#56B4E9")), 
         pch = 19, cex = 1.5, varNames = predictor_vars)

Summary

Show/Hide Code
cowplot::plot_grid(lda.kfoldCV_caret.ROC.plot,
                   lda.kfoldCV_MASS.ROC.plot,
                   ncol = 2, align = "hv", scale = 0.8)

Model Error Rate Sensitivity Specificity AUC
LDA (caret) 0.1919 0.9283 0.3305 0.6294448
LDA (MASS) 0.1591 0.9969 0.1143 0.5488133